说明
osquery作为一个主机信息收集的软件,限制其资源使用是非常重要的,尤其如果将osquery部署在高并发服务器的生产环境,查询进程信息、端口信息或者是audit信息,那么势必会造成osquery的内存激增,所以对于osquery的资源限制是必须的。facebook团队也考虑到这一点,于是在osquery中就内置了资源监控和资源限制的设置,具体可以参考Daemon control flags
watchdog
在说明watchdog之前,需要osquery中的一个基本的概念。以osqueryd为例,当我们启动osqueryd之后,查看osqueryd的进程:1
2
3$ ps -ef | grep osqueryd
root 28232 1 0 16:17 ? 00:00:00 /usr/bin/osqueryd --flagfile /etc/osquery/osquery.flags --config_path /etc/osquery/osquery.conf
root 28259 28232 2 16:17 ? 00:00:00 /usr/bin/osqueryd
可以发现存在两个与osqueryd相关的进程。其中pid为28232的osqueryd的进程是/usr/bin/osqueryd的父进程。此时pid为28232的osqueryd的进程称之为watcher进程,而pid为28259的进程称之为worker进程。实际执行query查询的是worker进程,而watcher进程则是负责对worker进程的资源监控。
Daemon control flags中介绍了常见的设置,其中与资源限制,资源监控相关的基本上都带有watchdog字样。
--disable_watchdog=false,默认值是false,表示osquery是默认开启资源监控的。如果发现超过了阈值,则会重启worker进程--watchdog_level=0,资源监控的级别,级别分为三档(0=normal, 1=restrictive, -1=disabled),默认是0。具体的级别划分可以参考英文原文.还可以将其设置为-1,表示完全禁用资源监控。这个和disable_watchdog的区别在于,--disable_watchdog=false仅仅只是对worker进程生效无法对扩展进程生效。而设置--watchdog_level=-1会同时worker进程和扩展生效。--watchdog_memory_limit=0,设置osquery内存使用阈值。由于在watchdog_level已经存在这个值的了,所以如果设置了watchdog_memory_limit就会覆盖掉watchdog_level中的值。--watchdog_utilization_limit=0同watchdog_memory_limit.--watchdog_delay=60在worker进程启动后,间隔watchdog_delay之后watcher进程才开始监控。因为worker进程刚启动时必然会涉及到资源的初始化等等,所以刚启动时内存和CPU占用比较多,此时就需要一个时间间隔,之后由watcher监控。--enable_extensions_watchdog=false,表示是否开启扩展的监控,默认是关闭的。但是即使在关闭情况下,watcher进程还是会监控扩展的异常关闭,只不过不监控扩展的使用情况。如果需要开启对扩展的资源的监控,将此选项设置为true即可。
watcher.cpp
与监控的代码位于osquery/core/watcher.cpp
kWatchdogLimits
在前面已经说到通过watchdog_level来控制监控级别,每一个监控级别具体的阈值的设定是在osquery的代码中硬编码的。1
2
3
4
5
6
7
8
9
10
11
12
13
14
15
16
17
18
19
20
21
22
23
24
25
26
27
28
29
30
31
32
33
34
35
36
37
38
39
40
41
42
43
44
45
46
47
48
49
50using WatchdogLimitMap = std::map<WatchdogLimitType, LimitDefinition>;
struct LimitDefinition {
size_t normal;
size_t restrictive;
size_t disabled;
};
const WatchdogLimitMap kWatchdogLimits = {
// Maximum MB worker can privately allocate.
{WatchdogLimitType::MEMORY_LIMIT, {200, 100, 10000}},
// % of (User + System + Idle) CPU time worker can utilize
// for LATENCY_LIMIT seconds.
{WatchdogLimitType::UTILIZATION_LIMIT, {10, 5, 100}},
// Number of seconds the worker should run, else consider the exit fatal.
{WatchdogLimitType::RESPAWN_LIMIT, {4, 4, 1000}},
// If the worker respawns too quickly, backoff on creating additional.
{WatchdogLimitType::RESPAWN_DELAY, {5, 5, 1}},
// Seconds of tolerable UTILIZATION_LIMIT sustained latency.
{WatchdogLimitType::LATENCY_LIMIT, {12, 6, 1000}},
// How often to poll for performance limit violations.
{WatchdogLimitType::INTERVAL, {3, 3, 3}},
};
size_t getWorkerLimit(WatchdogLimitType name) {
if (kWatchdogLimits.count(name) == 0) {
return 0;
}
if (name == WatchdogLimitType::MEMORY_LIMIT &&
FLAGS_watchdog_memory_limit > 0) {
return FLAGS_watchdog_memory_limit;
}
if (name == WatchdogLimitType::UTILIZATION_LIMIT &&
FLAGS_watchdog_utilization_limit > 0) {
return FLAGS_watchdog_utilization_limit;
}
auto level = FLAGS_watchdog_level;
// If no level was provided then use the default (config/switch).
if (level == -1) {
return kWatchdogLimits.at(name).disabled;
}
if (level == 1) {
return kWatchdogLimits.at(name).restrictive;
}
return kWatchdogLimits.at(name).normal;
}
getWorkerLimit(WatchdogLimitType::UTILIZATION_LIMIT).getWorkerLimit()根据传入的参数名称以及FLAGS_watchdog_level的等级决定在kWatchdogLimits中具体的取值。上述的代码结构还是很清晰的。
WatcherRunner
WatcherRunner就是watcher监控入口。1
2
3
4
5
6
7
8
9
10
11
12
13
14
15
16
17
18
19
20
21
22
23
24
25
26
27
28
29
30
31
32
33
34
35
36
37
38
39
40
41
42
43
44
45
46
47
48
49
50
51
52
53
54
55void WatcherRunner::start() {
// Hold the current process (watcher) for inspection too.
auto &watcher = Watcher::get();
auto self = PlatformProcess::getCurrentProcess();
// Set worker performance counters to an initial state.
watcher.resetWorkerCounters(0);
PerformanceState watcher_state;
// Enter the watch loop.
do {
if (use_worker_ && !watch(watcher.getWorker())) {
if (watcher.fatesBound()) {
// A signal has interrupted the watcher.
break;
}
auto status = watcher.getWorkerStatus();
if (status == EXIT_CATASTROPHIC) {
Initializer::requestShutdown(EXIT_CATASTROPHIC);
break;
}
if (watcher.workerRestartCount() ==
getWorkerLimit(WatchdogLimitType::RESPAWN_LIMIT)) {
// Too many worker restarts.
Initializer::requestShutdown(EXIT_FAILURE, "Too many worker restarts");
break;
}
// The watcher failed, create a worker.
createWorker();
}
// After inspecting the worker, check the extensions.
// Extensions may be active even if a worker/watcher is not used.
watchExtensions();
if (use_worker_) {
auto status = isWatcherHealthy(*self, watcher_state);
if (!status.ok()) {
Initializer::requestShutdown(
EXIT_CATASTROPHIC,
"Watcher has become unhealthy: " + status.getMessage());
break;
}
}
if (run_once_) {
// A test harness can end the thread immediately.
break;
}
pause(std::chrono::seconds(getWorkerLimit(WatchdogLimitType::INTERVAL)));
} while (!interrupted() && ok());
}
整个的监控是放在一个大型的while (!interrupted() && ok())中的。分步拆解一下。
watcher.getWorker()得到worker进程;watch(watcher.getWorker())监控worker进程,监控的所有信息全部是封装在watcher对象中。(小插曲其中watcher.fatesBound()用于判断watcher进程与worker进程是否是父子进程关系,如果发现不是,则中断监控);auto status = watcher.getWorkerStatus();,得到监控状态。根据不同的监控状态返回不同的错误信息;- 由于进入到
do{}中基本上都是watch(watcher.getWorker()监控到wroker的资源使用存在问题,最后调用createWorker();重启worker进程。
通过分析,在上述过程中watch()和createWorker()是最为关键的。
createWorker()
1 | void WatcherRunner::createWorker() { |
- 通过
exec_path = fs::system_complete(fs::path(qd[0]["path"]), ec);,得到osqueryd的执行路径; auto worker = PlatformProcess::launchWorker(exec_path.string(), argc_, argv_);,通过launchWorker()运行osqueryd,通过这种方式保证osqueryd启动。这种方式和之前文章osquery动态调试和重打包中所讲到的启动分析是一样的。最终是调用::execve(exec_path.c_str(), argv, ::environ);watcher.setWorker(worker);watcher.resetWorkerCounters(getUnixTime());重新设置worker的pid和启动时间;
watch()
watch()是整个监控系统的核心部分。watch()函数负责对worker进程各项指标进行监控,包括前面说的CPU,内存等等。1
2
3
4
5
6
7
8
9
10
11
12
13
14
15
16
17
18
19
20
21
22
23
24
25
26
27
28
29
30bool WatcherRunner::watch(const PlatformProcess &child) const {
int process_status = 0;
ProcessState result = child.checkStatus(process_status);
if (Watcher::get().fatesBound()) {
// A signal was handled while the watcher was watching.
return false;
}
if (!child.isValid() || result == PROCESS_ERROR) {
// Worker does not exist or never existed.
return false;
} else if (result == PROCESS_STILL_ALIVE) {
// If the inspect finds problems it will stop/restart the worker.
auto status = isChildSane(child);
// A delayed watchdog does not stop the worker process.
if (!status.ok() && getUnixTime() >= delayedTime()) {
stopChild(child);
return false;
}
return true;
}
if (result == PROCESS_EXITED) {
// If the worker process existed, store the exit code.
Watcher::get().worker_status_ = process_status;
return false;
}
return true;
}
watch()的参数const PlatformProcess &child就是worker进程;
Watcher::get().fatesBound()和WatcherRunner::start()一样,首先判断watcher进程与worker进程是否是父子进程关系。如果发现不是,则直接返回false;ProcessState result = child.checkStatus(process_status);,检查worker进程当前状态。如果检查到进程是PROCESS_ERROR或者是PROCESS_EXITED,则直接返回false;auto status = isChildSane(child);,如果发现worker进程正常运行,调用isChildSane()检测worker进程的资源问题;
isChildSane()
1 | Status WatcherRunner::isChildSane(const PlatformProcess &child) const { |
auto rows = getProcessRow(child.pid());,根据worker进程的pid在process表中查询信息,在processauto &state = Watcher::get().getState(child);拿到worker进程的信息。getState()1
2
3
4
5
6
7
8PerformanceState state_;
PerformanceState &Watcher::getState(const PlatformProcess &child) {
if (child == getWorker()) {
return state_;
} else {
return extension_states_[getExtensionPath(child)];
}
}watch.h:PerformanceState1
2
3
4
5
6
7
8
9
10
11
12
13
14
15
16
17
18
19
20
21struct PerformanceState {
/// A counter of how many intervals the process exceeded performance limits.
size_t sustained_latency;
/// The last checked user CPU time.
size_t user_time;
/// The last checked system CPU time.
size_t system_time;
/// A timestamp when the process/worker was last created.
size_t last_respawn_time;
/// The initial (or as close as possible) process image footprint.
size_t initial_footprint;
PerformanceState() {
sustained_latency = 0;
user_time = 0;
system_time = 0;
last_respawn_time = 0;
initial_footprint = 0;
}
};可以看到
PerformanceState是一个结构体,存储了:sustained_latency,超出限制的次数;user_time,worker使用用户态cpu时间(源于process表)system_time,worker使用内核态cpu时间(源于process表)last_respawn_time,上一次启动时间initial_footprint,内存快照
getProcessRow()1
2
3
4
5
6
7
8
9
10
11
12QueryData WatcherRunner::getProcessRow(pid_t pid) const {
int p = pid;
WIN32 code....
return SQL::selectFrom(
{"parent", "user_time", "system_time", "resident_size"},
"processes",
"pid",
EQUALS,
INTEGER(p));
}getProcessRow(pid_t pid)其实就是查询的processes表,然后获取了parent(父进程进程ID即PPID),user_time(在用户态运行的CPU时间),system_time(在内核态运行CPU的时间),resident_size(进程使用的私有内存大小)。getProcessRow(pid_t pid)查询得到的信息与第二步中的auto &state = Watcher::get().getState(child);得到的信息基本一致。在processes表中查询到的是worker当前状态下的实时资源使用信息。这样通过比较之前的资源使用情况和当前的进程的使用情况,通过change = getChange(rows[0], state);比较分析就能够判断当前的进程是否存在问题。change.parent != PlatformProcess::getCurrentPid(),这种情况下有可能是worker进程中途发生了改变,此时比较之后如果发现不一样,就执行Watcher::get().reset(child);重置watcher监控进程的子进程。调用
(exceededMemoryLimit(change)和exceededCyclesLimit(change)对change之后的结果进行判断,分别判断内存和CPU的情况。以exceededMemoryLimit(chaneg)为例来说明。1
2
3
4
5
6
7
8static bool exceededMemoryLimit(const PerformanceChange &change) {
if (change.footprint == 0) {
return false;
}
return (change.footprint >
getWorkerLimit(WatchdogLimitType::MEMORY_LIMIT) * 1024 * 1024);
}通过
change.footprint >getWorkerLimit(WatchdogLimitType::MEMORY_LIMIT) * 1024 * 1024,通过判断diff的结果与预设的结果的比较。而WatchdogLimitType::MEMORY_LIMIT的定义在前面的kWatchdogLimits中已经说明了。
- 由此看来在
isChildSane(const PlatformProcess &child)中最为关键的是比较方法,即change = getChange(rows[0], state);
getChange
1 | PerformanceChange getChange(const Row &r, PerformanceState &state) { |
在getChange()函数中,主要是对内存和CPU的使用情况进行了判断,由于这两个逻辑是混在一起的。为了便于分析,我们将内存和CPu的使用情况分开分析。
footprint
1 | change.footprint = tryTo<long long>(r.at("resident_size")).takeOr(0LL); |
change.footprint = tryTo<long long>(r.at("resident_size")).takeOr(0LL);,change.footprint拿的就是在上面通过查询process表拿到的结果,即当前情况下worker进程的资源使用情况;
其中state则是PerformanceState结构体,存储了当前的worker的资源使用信息。
初始化change.footprint中存储的就是当前的信息,最终返回change.footprint = change.footprint - state.initial_footprint。此时change.footprint返回的就是当前的资源使用与上一次的资源使用的差值。其中的一个小细节就是,如果返现change.footprint < state.initial_footprint,那么就将change.footprint置为0,也就是说差值都是大于或等于0的。
sustained_latency
时钟频率的判断也比较的简单。1
2
3
4
5
6
7
8
9
10
11
12
13
14
15
16
17
18
19// cpu_ul的默认设置
UNSIGNED_BIGINT_LITERAL cpu_ul = (percent_ul * iv_milliseconds * kNumOfCPUs) / 100;
// 得到当前状态的在用户态下消耗的时间和在内核态下消耗的时间
user_time = tryTo<long long>(r.at("user_time")).takeOr(0LL);
system_time = tryTo<long long>(r.at("system_time")).takeOr(0LL);
auto user_time_diff = user_time - state.user_time;
auto sys_time_diff = system_time - state.system_time;
// cpu_utilization_time 就是当前状态与上次状态的内核态时间和用户态时间的差值总和
auto cpu_utilization_time = user_time_diff + sys_time_diff;
// 如果超过了cpu_ul的默认设置,则sustained_latency的数量加1,为什么使用的是state.sustained_latency?因为state.sustained_latency可能之前就不为空,之前就有可能超过了预设的设置
if (cpu_utilization_time > cpu_ul) {
state.sustained_latency++;
} else {
state.sustained_latency = 0;
}
// 将state.sustained_latency赋值给change.sustained_latency,用于之后的CPU资源使用的分析判断。
change.sustained_latency = state.sustained_latency;、
最后通过change = getChange(rows[0], state);得到了变化情况之后,分别调用exceededCyclesLimit(change)和exceededMemoryLimit(change)进行分析判断CPU和内存是否超标,具体的实现方法在前面也简要地说明了。如果最终发现存在问题,则返回类似于return Status(1, "Memory limits exceeded: " + std::to_string(change.footprint));的错误信息,如果运行正常,则返回Status(0)
watch(const PlatformProcess &child)
前面已经说过了watch()是整个监控系统的核心部分。watch()函数负责对worker进程各项指标进行监控。那么就会根据isChildSane(child)的检测结果决定下一步的动作。1
2
3
4
5
6
7
8
9
10
11
12
13
14
auto status = isChildSane(child);
// A delayed watchdog does not stop the worker process.
if (!status.ok() && getUnixTime() >= delayedTime()) {
    // Since the watchdog cannot use the logger plugin the error message
    // should be logged to stderr and to the system log.
    std::stringstream error;
    error << "osqueryd worker (" << child.pid()<< ") stopping: " << status.getMessage();
    systemLog(error.str());
    LOG(WARNING) << error.str();
    stopChild(child);
    return false;
}
return true;
如果发现worker的资源使用过多,就会调用systemLog(error.str());打出日志,同时还会调用stopChild(child);停止掉worker进程。1
2
3
4
5
6
7
8
9
10
11
12
13
14
15
16
17
18
19
20
21
22
23
24
25
26
27
28
29
30void WatcherRunner::stopChild(const PlatformProcess &child) const {
child.killGracefully();
// Clean up the defunct (zombie) process.
if (!child.cleanup()) {
auto child_pid = child.pid();
LOG(WARNING) << "osqueryd worker (" << std::to_string(child_pid)
<< ") could not be stopped. Sending kill signal.";
child.kill();
if (!child.cleanup()) {
auto message = std::string("Watcher cannot stop worker process (") +
std::to_string(child_pid) + ").";
Initializer::requestShutdown(EXIT_CATASTROPHIC, message);
}
}
}
`osquery/core/posix/process.cpp`
bool PlatformProcess::killGracefully() const {
if (!isValid()) {
return false;
}
// 关于kill进程的用法:http://man7.org/linux/man-pages/man2/kill.2.html
// In the case of SIGCONT, it suffices when the sending and receiving processes belong to the same session
int status = ::kill(nativeHandle(), SIGTERM);
return (status == 0);
}
通过追踪调用栈,可以发现最终调用的是::kill(nativeHandle(), SIGTERM)方法杀掉worker进程的。
start()
1 | do { |
在WatcherRunner::start()中发现watch(watcher.getWorker())发现workder的状态有问题时,最终就会调用createWorker();重新启动新的worker进程(之前的worker进程已经在watch(const PlatformProcess &child)中被干掉了)。
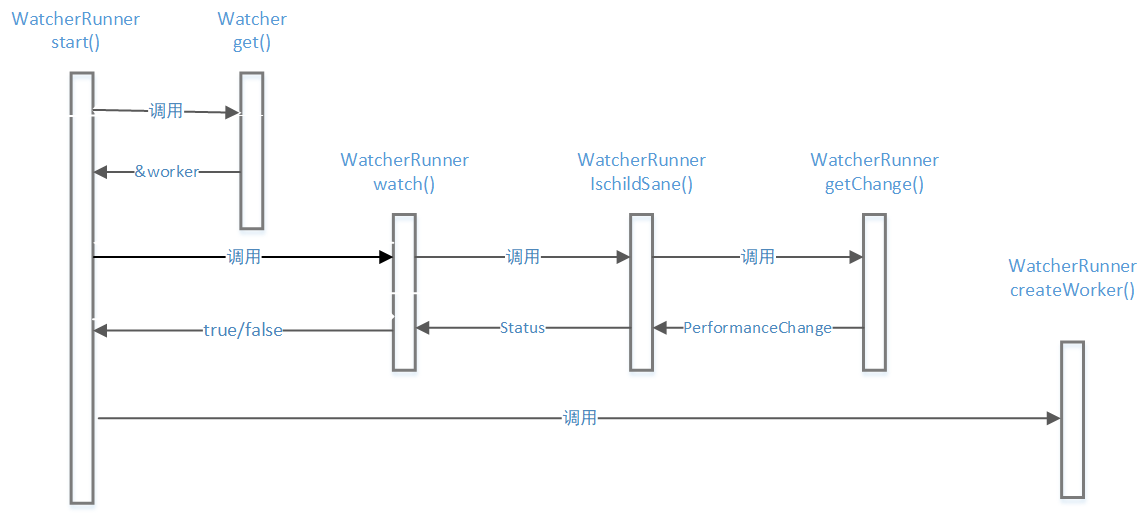
整体来说,整个检测逻辑还是比较简单的,唯一有点痛苦的是,可能你如果不分析源代码,对其中的函数调用关系难以理清楚,下面这个图可能帮助清理osquery的整个监控逻辑。
总结
HIDS中的Agent熔断机制,监控机制的设计和实现是在设计HIDS中需要着重考量的一个地方,因为一旦出现了大量的资源占用的情况,要求我们能够能够及时地停止我们的agent的信息收集活动。通过分析osquery的监控机制,也为我们自己实现监控和熔断提供了一些思路。